Reading a stock chart in minutes
Harry Read · · Updated
New on Baseline: price annotations
When I first started looking at a company, I would spend one to two hours working out the major moves in the stock. Pull up the chart, mark the days where it significantly moved up or down, then go back through the news, the results releases and broker notes to work out why each one happened. It was necessary work to understand what the market actually cares about. However, it was slow, and on a name you were only screening it was hard to justify.
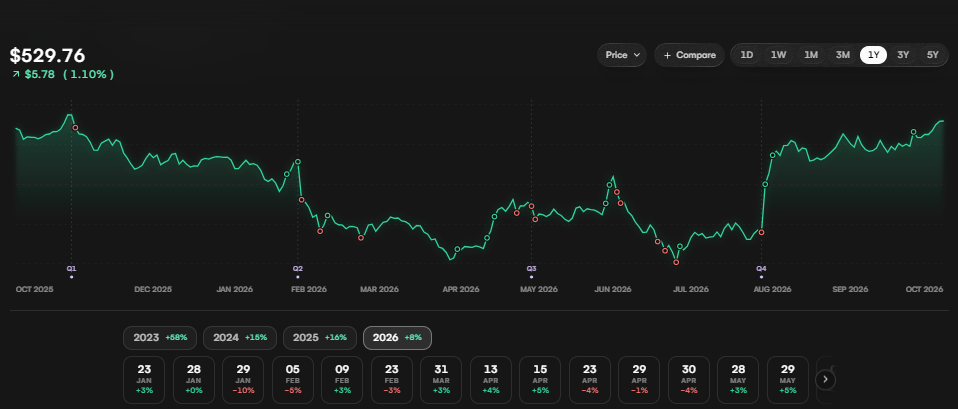
We have just shipped a feature on Baseline that does this work. Every company page now carries price annotations: for each year it picks out the biggest daily moves, every results day plus the other sessions that stood out, and writes a dated, sourced note on why the shares moved, alongside a summary of the year as a whole. It is live now across the universe, and the screengrabs below are taken from Microsoft’s page.
The markers on the chart are the annotated days, green for up and red for down, and the summary underneath covers the year. For Microsoft that reads as a record fall after the January results, a bear market in June on capex, regulation and supply worries, then a recovery that started with the July results. The shares fell to $352.83 on 25 June, 27% below where they started the year, and were back at $526.25 on 5 October.
29 January
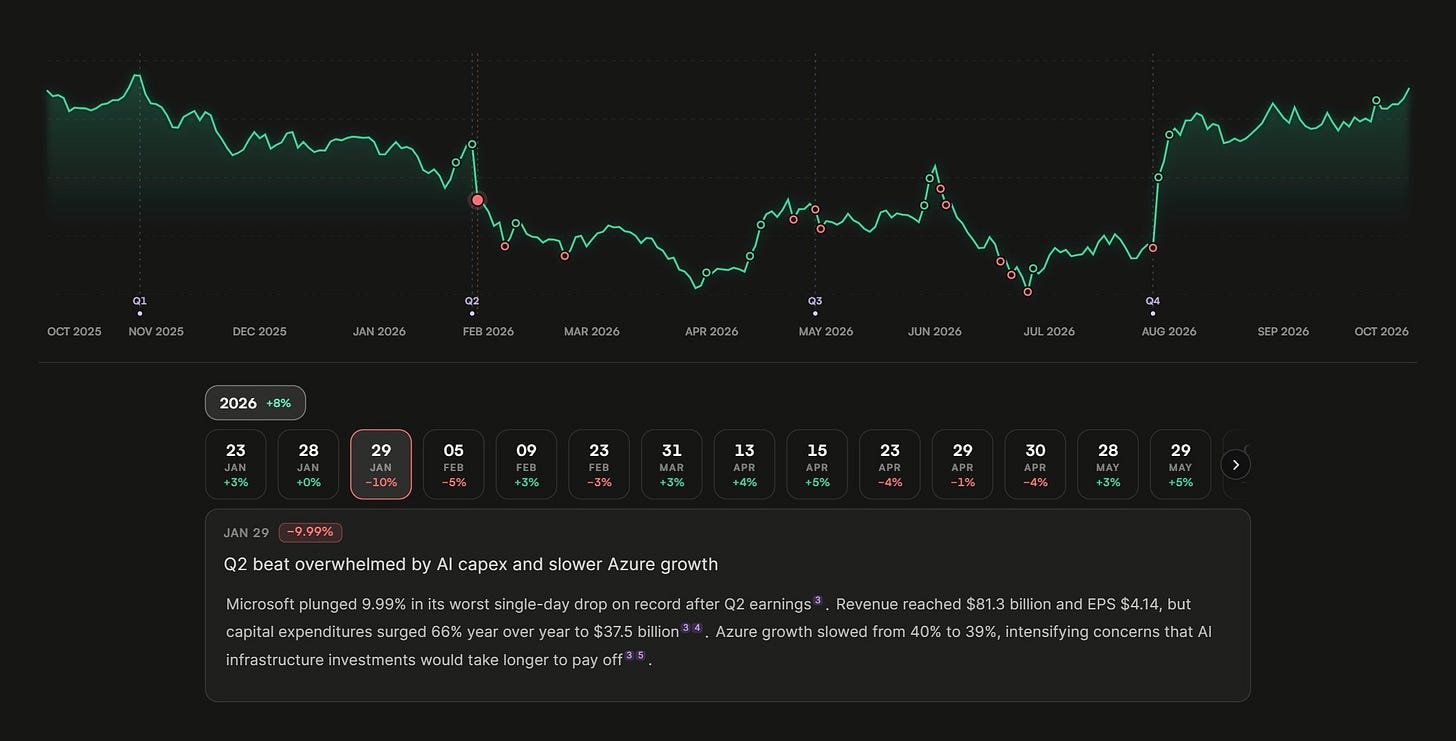
Clicking a date marks it on the chart and opens the note. Here, second-quarter revenue was $81.3bn, up 17%, and Azure grew 39%. However capital expenditure including finance leases rose 66% to $37.5bn and the shares fell 10%, the worst day in the company’s history and about $360bn of market value (TradingView). The numbers behind each claim are footnoted to the source.
26 June
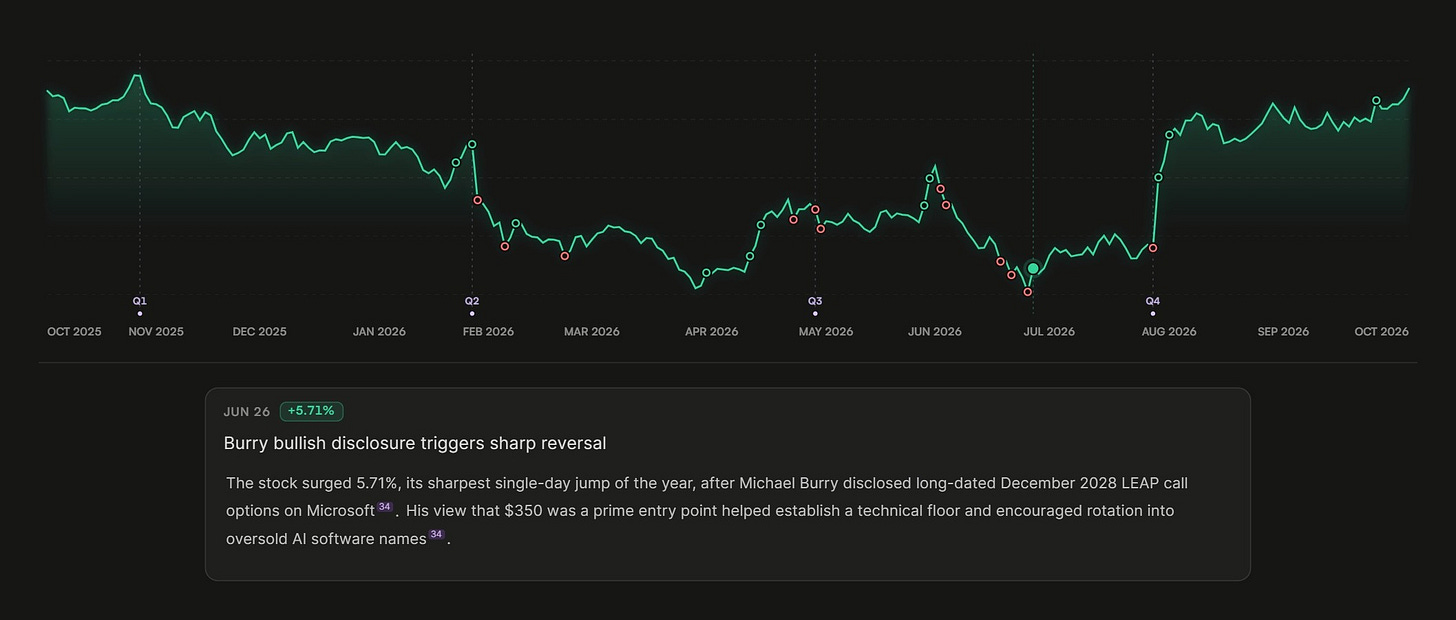
June is the cluster of red markers before this. The annotations pick up a US review programme for advanced AI models, a wider FTC probe, EU cloud rules, a failed attempt to lease capacity from Oracle and class actions over Copilot. By 22 June the shares were more than 20% below their 1 June peak, with money rotating out of software into semiconductors (Stocktwits). The turn came the day after the low, when Michael Burry disclosed December 2028 call options and said he saw $350 as a good level to buy. The shares rose 5.7% to $372.97 (TIKR). Days like this show the value in the feature, since nothing came from the company and the explanation was in a Substack post.
30 July
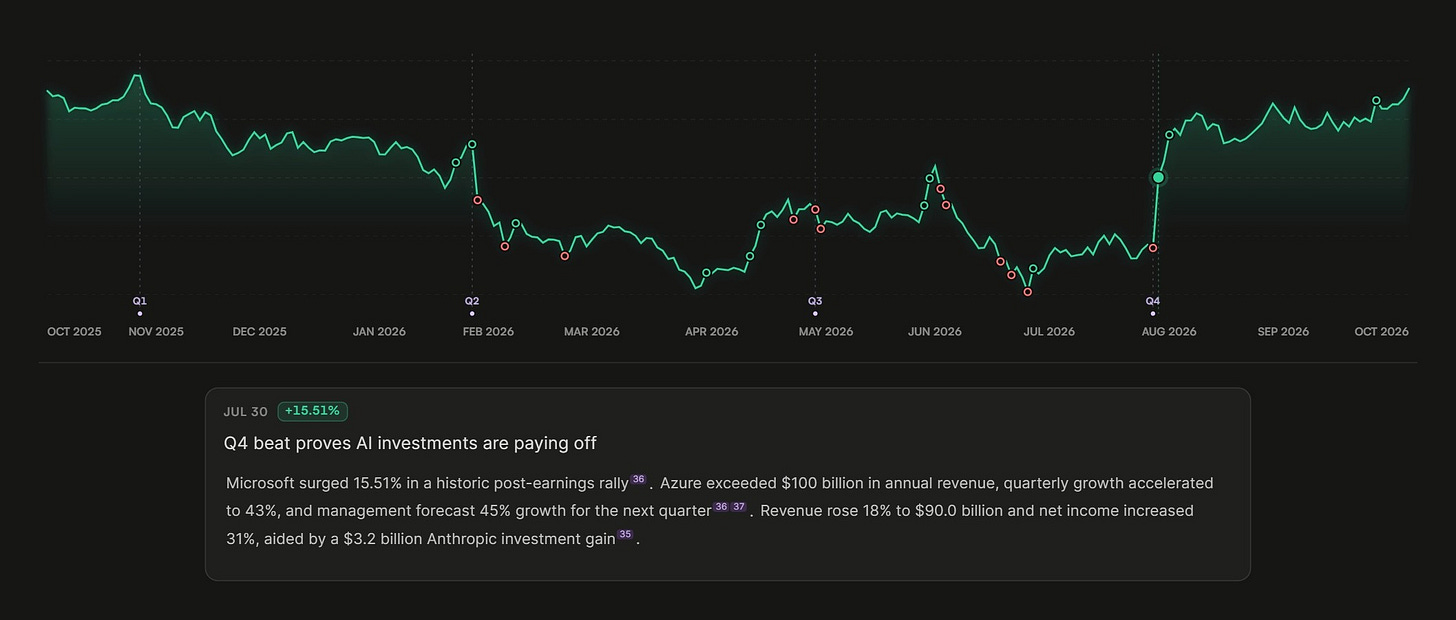
Fourth-quarter revenue was $90.0bn, up 18%, Azure grew 43% and passed $100bn of revenue for the year, and net income rose 31% with help from a $3.2bn gain on the Anthropic stake (Microsoft). The shares rose 15.5%. Put the three results days together and they almost cancel: down 10.0%, down 3.9% after the April numbers and up 15.5% in July compound to roughly flat. Over the same three quarters Azure growth went from 39% to 40% to 43%.
Where it fits with the scores
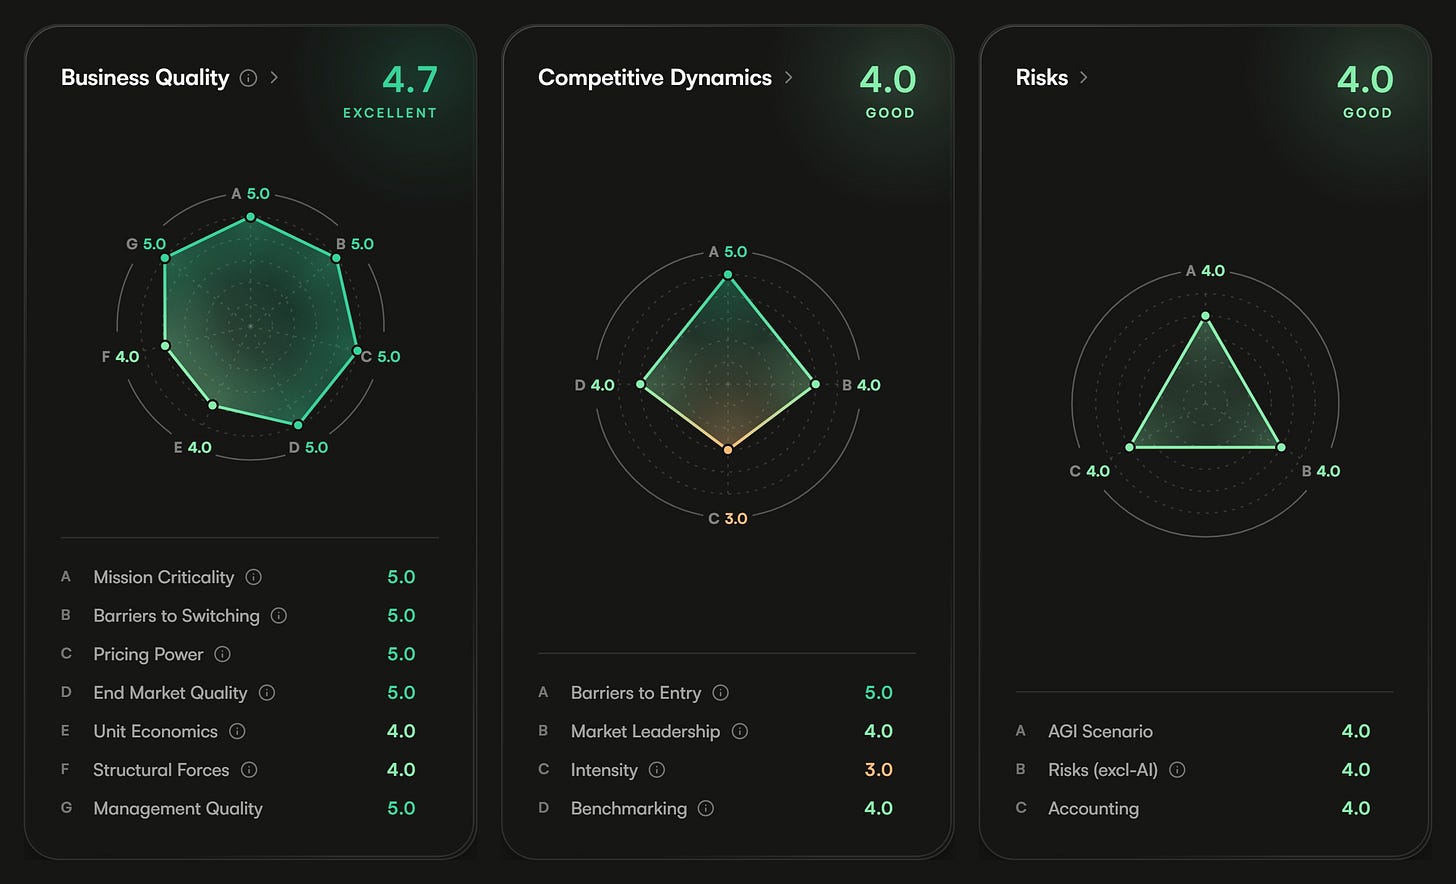
Knowing why a stock moved is most useful next to a view of the business. Microsoft scores 4.7 on Business Quality, with Mission Criticality, Barriers to Switching, Pricing Power, End Market Quality and Management Quality all at 5. The June annotations are about capex, regulation and competition rather than customers leaving Microsoft 365 or weak Azure demand, so they don't show up in Business Quality.
Unit Economics scores 4 because the return on the marginal AI dollar is unproven at scale and free cash flow conversion has fallen from around 90% to around 70%. Intensity scores 3 because competition at the AI application layer, Copilot in particular, is harder than elsewhere in the portfolio.
Check out price annotations at https://baseline.a5labs.com.